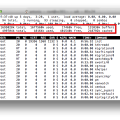
When you run top command, you get many informations about your system

The CPU(s) row shows:
CPU state percentages based on the interval since the last refresh. Where two labels are shown below, those for more recent kernel versions are shown first.
us, user : time running un-niced user processes
sy, system : time running kernel processes
ni, nice : time running niced user processes
wa, IO-wait : time waiting for I/O completion
hi : time spent servicing hardware interrupts
si : time spent servicing software interrupts
st : time stolen from this vm by the hypervisor
The Mem and Swap row show:
This portion consists of two lines which may express values in kibibytes (KiB), mebibytes (MiB) or gibibytes (GiB) depending on the amount of currently installed physical memory.
- Line 1 reflects physical memory, classified as: total, used, free, buffers
- Line 2 reflects virtual memory, classified as: total, used, free, cached
Physical memory is your RAM, physical pieces of hardware that provide Random Access Memory.
Swap is virtual memory which can be a file or a partition on your hard drive that is essentially used as extra RAM. It is not a separate RAM chip though, it resides on your hard drive.
The last section provides information about the currently running processes. It consists of the following columns:
PID — Process Id : This is a unique number used to identify the process.
User : The username of whoever launched the process.
PR — Priority : The priority of the process. Processes with higher priority will be favored by the kernel and given more CPU time than processes with lower priority. Oddly enough, the lower this value, the higher the actual priority; the highest priority on *nix is -20 and the lowest is 20.
NI — Nice value : nice is a way of setting your process’ priority. See here for more details.
VIRT — Virtual Memory Size (KiB) : The total amount of virtual memory used by the process.
RES — Resident Memory Size (KiB) : The non-swapped physical memory a task has used.
SHR — Shared Memory Size (KiB) : The amount of shared memory available to a task, not all of which is typically resident. It simply reflects memory that could be potentially shared with other processes.
S — Process Status : The status of the task which can be one of:
- ‘D’ = uninterruptible sleep
‘R’ = running
‘S’ = sleeping
‘T’ = traced or stopped
‘Z’ = zombie
%CPU — CPU Usage : The percentage of your CPU that is being used by the process. By default, top displays this as a percentage of a single CPU. On multi-core systems, you can have percentages that are greater than 100%. For example, if 3 cores are at 60% use, top will show a CPU use of 180%. You can toggle this behavior by hitting Shifti while top is running to show the overall percentage of available CPUs in use.
%MEM — Memory Usage (RES) : A task’s currently used share of available physical memory (RAM).
TIME+ — CPU Time, hundredths : Total CPU time the task has used since it started.
COMMAND — Command Name or Command Line : To see the full command line that launched the process, start top with the -c flag : top -c.
source :
http://superuser.com/questions/575202/understanding-top-command-in-unix/575330#575330