Monitoring MySQL server is no rocket science, provided you know what to monitor. MySQL gives a comprehensive list of variables to check your server’s health and performance. Let’s walk you through the crucial variables you should be monitoring. Let’s assume that you have one or more MySQL servers, which have been setup and running fine.
Aborted connects
aborted_connects gives the total number of failed attempts to connect to MySQL. Excess aborted_connects indicate that the client does not have enough privileges, or the client uses an incorrect password, or someone is trying to hack into your server. aborted_connects is a global status value and can be retrieved using-
SHOW GLOBAL STATUS LIKE 'aborted_connects';
Slow Query log
Consists of all the queries that exceed long_query_time seconds to execute. More slow queries would mean more disk reads, more memory usage, more CPU usage which ultimately just slows down your servers, causes bottlenecks and hence results in poor performance. Slow Query log is where you find queries that are potential targets for optimization.
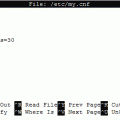
Percentage of maximum allowed connections
A high value of the percentage of maximum allowed connections (max_used_connections / max_connections) tells that you could soon run out of client connections. In other words, new connection requests will simply be refused. So make sure your max_connections is large enough to suit your application. By executing
SHOW GLOBAL VARIABLES LIKE 'max_connections';
SHOW GLOBAL STATUS LIKE 'max_used_connections';
you can track maximum allowed connections.